
Spectrum window (display functions)
The Spectrum window (SpWin) is one of the four basic windows of the LWW program, which remains permanently open. It serves for viewing the plot of the studied spectrum in a form, which is contextually bound to the content of the Assignment and Loomis-Wood windows. It can be, however, also used for simple viewing and plotting the IR spectrum without any assignment project related to it. The content of this window is bi-directionally synchronized with the PeakList window (PkLWin) which is opened by the View peak table command of the Peaks menu of the LWW program.
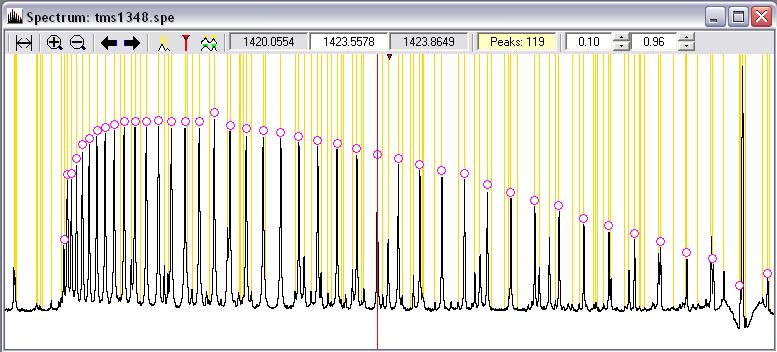
First, let us first overview the basic functions of the overview mode. When the
project is created, the full range of the spectrum is displayed. The lowest and
highest wavenumber in the displayed range and the number of peaks are shown in
the toolbar of the window. Between the text box displaying the lowest and
highest wavenumbers (appearing with a grey background), the third text box with
white background shows the current position (wavenumber) of the cursor. The
spectrum can be zoomed in  and
out
and
out  by the second and third button
from the left on the SpWin toolbar. The wavenumber in the center of the SpWin
(denoted with a small red triangle at the top of the spectrum plot area) stays
in its place during zoom-in/out actions. Zooming-in magnifies the spectrum
twice (i.e. displaying half of the range shown previously) and zooming-out
displays a wavenumber region two times larger. Zooming-in can be also performed
on a wavenumber interval selected in the plot area by dragging (clicking and
holding the mouse button during moving the cursor, which shows the selected
interval in inverse) and subsequently clicking on the zoom-in button. The full
range can be restored by clicking on the Full spectrum range
by the second and third button
from the left on the SpWin toolbar. The wavenumber in the center of the SpWin
(denoted with a small red triangle at the top of the spectrum plot area) stays
in its place during zoom-in/out actions. Zooming-in magnifies the spectrum
twice (i.e. displaying half of the range shown previously) and zooming-out
displays a wavenumber region two times larger. Zooming-in can be also performed
on a wavenumber interval selected in the plot area by dragging (clicking and
holding the mouse button during moving the cursor, which shows the selected
interval in inverse) and subsequently clicking on the zoom-in button. The full
range can be restored by clicking on the Full spectrum range
 button of the toolbar.
The spectrum plot can be scrolled left/right either by clicking the scroll
buttons of the SpWin toolbar  or the left/right
arrow keys on the keyboard.
or the left/right
arrow keys on the keyboard.
The sixth button of the toolbar toggles on and off the yellow markers of the peaks, which are contained in the peaklist. The PklWin is synchronized with the SpWin in the sense that the line with the wavenumber of the peak, on which a right click has been performed in SpWin, gets highlighted in PklWin.
The seventh button of the toolbar toggles on and off the red vertical line, which denotes the position of the predicted wavenumber (WnCalc) of the particular transition selected in the Assignments or Loomis-Wood windows (for details see also the description of these windows).
The vertical scale of the Spectrum window can be zoomed by the up/down keyboard arrows. This function is used only for fast magnification of the weaker lines. Setting of the lower/upper limit of displayed absorption intensities can be done in the Spectrum tab of the Options command in the File menu.
The section of the spectrum displayed in the Spectrum window can be exported into a bitmap graphical file. Together with this, the corresponding part of the peak list file is exported into a text file.
It should be noted here that the spectrum plot can be generated from the Peaklist file in case when the file with the experimental recording of the spectrum does not exist. For this the Make spectrum from peaks item from Peaks menu of the LWW program can be used.
The special layout of SpWin can be adjusted by functions of the Spectrum menu of the LWW program.
The basic display functions of the Spectrum Window cover the following actions
- Zooming the spectrum in and out and unzooming to the full range
- Scrolling around the wavenumber range up and down
- Changing min and max visible intensity
- Exporting the displayed part of the spectrum into a graphical and text file
- Creating a plot of the spectrum from the peaklist