
Example of a resonance in the Loomis-Wood diagram
The current example shows how a local resonance distorts the regular spacing of lines in a rQ - branch of a perpendicular band of a symmetric top molecule and how this pattern is translated to the corresponding Loomis-Woold diagrams.
Typical pattern of a rQ-branch of
a perpendicular band perturbed by a local resonance
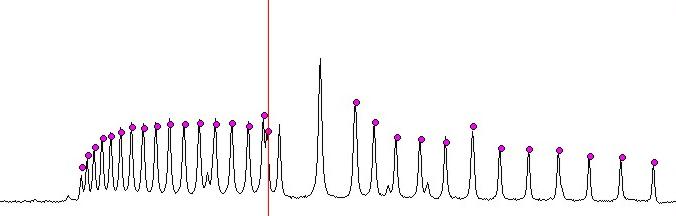
Before the resonant term is fitted, the series of peak markers in the Loomis-Wood diagram is broken into two parts, which are below and above the crossing displaced to opposite sides from the central vertical line.
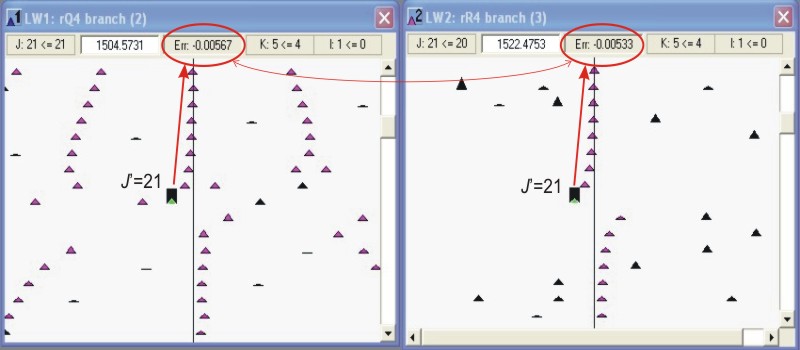
The illustrative figure shows also, how such distorted Loomis-Wood patterns have similar shapes in two LW diagrams related by combination differences, here the rQ- and rR-branches of the nu5 band in particular. The verification of correct assignments in the two displayed branches is done by comparing the values of Errors (= WnObs - WnCalc), which should not be different by more than the experimental uncertainty of line wavenumbers.
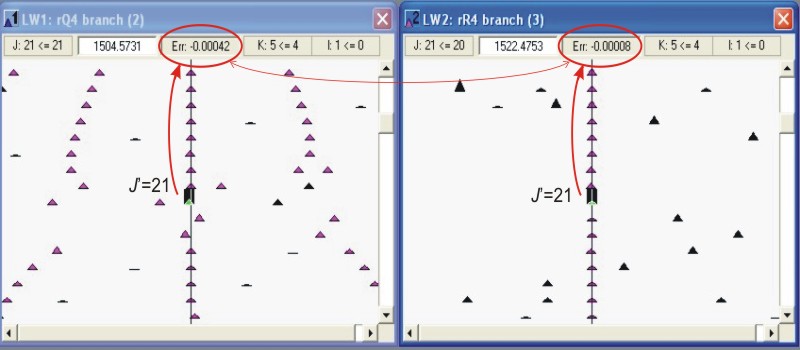
When the resonance term is fitted (which means that the assigned data of these perturbed branches were exported to an external fitting program and the refined energies imported back to the Loomis-Wood program), the resonace pattern is smoothed out and becomes dispalyed as a straight line in the center of the LW diagrams.
This example is taken from the analysis of the v2=1,v5=1, and v3=2 levels of 13CH335Cl. The resonance is an alpha-resonance affecting the rQ4-branch of the nu5 band.